Atmosphere
 Atmos. turbulences
 Ocean and climate
 Natural Factors
 Climatic and oceanic phenomenas
 Photos, videos
 Diverse
 Simulations...
|
3st
PART
In this phenomenon of oscillation, E.N.S.O., the cold phase is called La Niña. The latter is the opposite of El Niño and this can be seen in the SST and atmospheric pressure anomalies of the Pacific. The waters of the Eastern Pacific are cooler than normal and the waters of the Western Pacific are warmer. Atmospheric pressures are lower in the West, but higher in the East.
During La Niña the thermocline descends to
the Western Pacific and rises to the The occurrence of this phenomenon depends on the reflection of oceanic waves on the coasts of Indonesia or South America. When Kelvin waves are reflected on the coast of South America in Rossby waves in the West, the thermocline rises to the Pacific East and descends to the West. Then the temperature of the ocean surface varies. The cold water of the thermocline goes up again, cools the surface of the Eastern Pacific, causing instability of the atmosphere-ocean coupling. The trade winds blow more strong pushing the warm surface waters to Indonesia and Australia allowing the upwelling of cold water on the surface. These anomalies in the temperature of the surface of the Pacific strengthen the depression of Indonesia and Australia and the Eastern Pacific anticyclone.
The classic Nina is a phenomenon that is all the opposite of El Niño classic and has therefore opposite consequences. The warmer waters in Indonesia gradually warm up 84,2°F (29°C) and the sea level rises of 40 cm on the Western edges of the basin. Which amplifies precipitation southeast Asia and eastern Australia, causing major floodings. Monsoons are also abnormally high in India. South Africa also faces more rain. But the intertropical islands of the Central Pacific and on the other side of the Pacific : Southern North America, North of Mexico and California... experience periods of pronounced droughts. This climatic phenomenon increases the number of hurricanes in the Atlantic as it decreases the vertical wind shear. Pacific forces and storm tracks are different as jet stream changes of latitude, they are less frequent.
Variation of the position of the Jet stream during La Niña
Since 2007 a new type of La Niña was discovered from analysis of a Japanese team that have named it La Niña Modoki in Japanese. It is distinguished from the classic La Niña by its specific impact on the global atmospheric circulation. Traditionally, the classic La Niña is associated with the cooling in the eastern tropical Pacific (Niño 1+2 et 3). However, during La Niña Modoki the anomaly of the sea surface temperature (SST) in the eastern Pacific isn't affected by cooling but by warming just like western equatorial Pacific, while a cold anomaly affects the central equatorial Pacific (Niño 3.4). These zonal gradients of SST result in an anomaly in circulation of two Walker cells on the tropical Pacific, with a humid region in the Eastern and the Western Pacific. The thermocline doesn't switch the same way as during the classical La Niña because this one raises at the Eastern Equatorial Pacific to sink at the West while during its cousin the thermocline raises at the center of equatorial Pacific Ocean and sinks at each end of the Pacific.
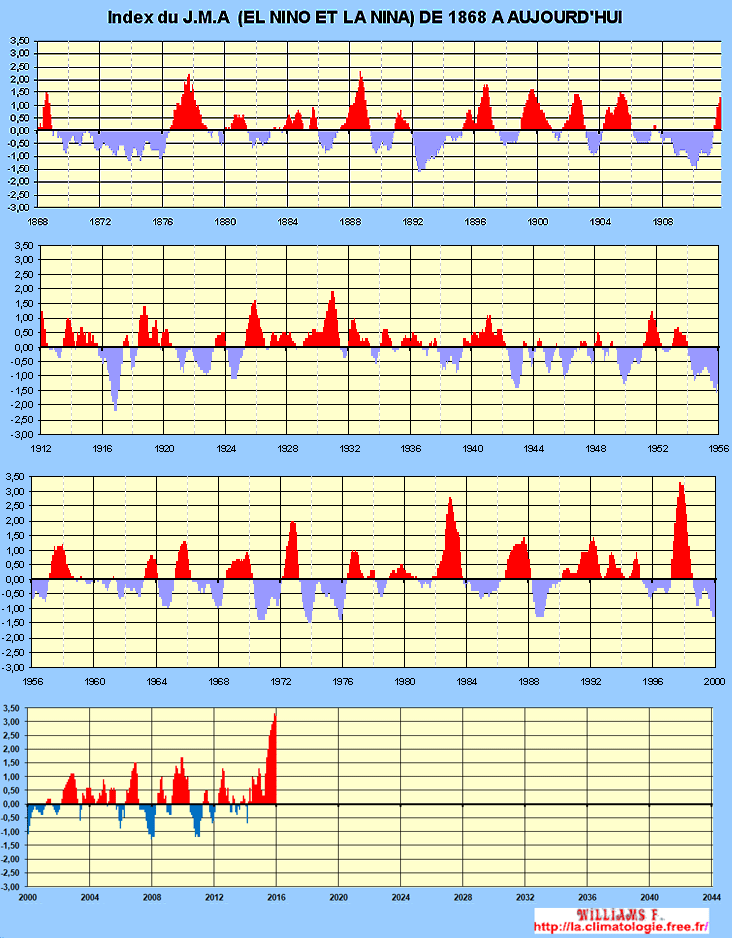
INDEX AND TECHNIQUES FORECASTS OF ENSO
Ocean surface temperature and atmospheric pressure are constantly measured by moored buoys and satellites around the Earth (Poseidon, Jason...). From these data are calculated indexes giving a more exact idea about the evolution of ENSO.
This graph was created and is updated according
to NOAA
data
NORMAL EL NINO LA NINA Click here to see the reconstitution of the surface characteristics WARNING
|
||||||||||||||||||||||||||||||||||