 Atmosphere
 Atmos. turbulences
 Ocean and climate
 Natural Factors
 Climatic and oceanic phenomenas
 Photos, videos
 Diverse
 Simulations...
III
THE ARCTIC
|
1st PART
|
|
|
|
|
|
|
SYNCHRONIZATION BETWEEN THE ICE FIELD OF THE NORTH POLE AND SOUTH POLE |
 |
![]()
THE NORTH AND SOUTH POLE
- DESCRIPTION
|
The Arctic Circle is located from the latitude of 66 ° 33 '39 "due to the tilt of the Earth 66 ° 33' 39". This is the area from where the sun is visible 24h/24 (polar day) to 21 June in the Northern Hemisphere as the sun does not go down below. Then the sun does not rise (polar night) in the northern hemisphere during the solstice, on 21 December, and reverse in the Southern Hemisphere. More is being approached from the geographic pole, so the latitude of 90° and over the period of the polar night and the polar day lengthens which 2 months at 70°, 4 months at 80° latitude, and a maximum of 6 months at the pole. |
 |
A video of the polar climate. https://www.youtube.com/watch?v=ruMQRCRMAnI
Every winter, the oceans around the poles freeze to form the sea ice. Due to the salinity of the sea water, the surface begins to freeze from 28,76°F (-1, 8°C). The sea ice of the poles is an important element in the climate due to the albedo.
|
cold fresh snow
|
until 90-98 % |
|
slush
|
50-60 % |
|
dirty sleet
|
40 % |
|
glacier
|
50 % |
|
ocean
|
5-15 % |
|
sea ice
|
50-85 % |
|
sandy desert
|
until 35 % |
|
bare rocks
|
20-25 % |
When talking about the surface of the sea ice, so do not confuse
the extent (09/21/07: 4,14 millions Km²) and the area
(09/21/07 : 2,92 millions Km²).
To simplify the area reported "extent", that is the extent
of sea occupied significantly by floating ice and therefore also with
open water areas in cracks..., while the area only concerns the olone
area occupied by the floating ice. So the extent is still above the
area.
- ARCTIC
|
ARCTIC GROENLAND |
 |
Because of global warming the surface of the Arctic sea ice is decreasing year to year and see more and faster in recent years. In September 2007 the melting of sea ice reached a record with an area of only 4,14 millions km², so 1,2 million km² (about twice the surface of France) less than the previous record set in September 2005 with an area of 5,32 millions km². This shows that within two years, the surface of sea ice has lost 22%. The rate of melting of ice since 1979 is 10% per decade. The rate of melting of ice since 1979 is 10% per decade. The decrease in the surface of the pack ice that was concentrated in the eastern Arctic therefore off the coast the Eurasian continent, as this is where the ice is the younger and thus slimmest and the most sensitive.
Ice from the sea ice shrinks not only on the surface but also in thickness. Reducing the coverage of sea ice in the Arctic Ocean is about 40%, and is thus changed from about 3,1 m to 1,9 m between 1950 and 1997. In 6 years (from 2001 to 2007) the thickness of the pack ice is even decreased from 1,9 m to 1 m.
The Arctic sea ice also evolves according to the climatic phenomenon the Arcti Oscillation (AO) which has links with the strength of the polar vortex.
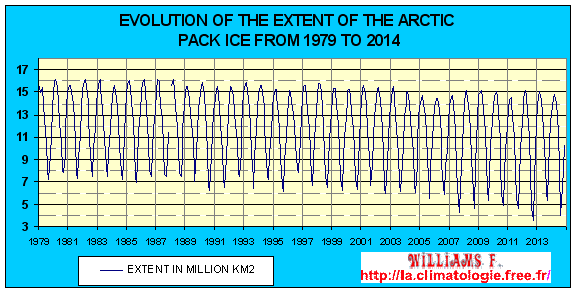
Created and updated with the data NOAA
- ANTARCTIC
|
Superficie : 13 200 000 Km², (5th largest)). Maximum ice thickness: 4776 m, on the Wilkes Land. The ice cap is 90% of the world's ice. Population : no Highest point: Vinson Massif, peak, 16,860 ft (5.139 m) high. South Pole for the first time reached by Roald Amundsen in December 1910. The average temperature in winter : -90,4°F (-68°C) Distance from other continents : South America, 960 km ; Australia, 2700 km ; Africa, 4000 km. |
 |
Une vidéo de l'Antarctique https://www.youtube.com/watch?v=Ymxi5wsqtEU
Unlike the Arctic, the maximum surface of the Antarctic pack ice is increasing since 1997. In 2012 it reached a record high of 19,39 millions km2, in 2013 it reached the new record of 19,77 millions km2 and in 2014 it exceeded 20 million km2. See here the records of its surface since 1979 including the first 8 records that occurred in the last 15 years.
Because of the cold greater than in the North Pole, the surface and the thickness of the Antarctic pack ice is greater than that of the Arctic which gives a stronger polar vortex over Antarctica.
The evolution of the Antarctic ice evolves according to the climatic phenomenon the Antarctic Oscillation (AAO) which has links with the power of the polar vortex and direction of winds.
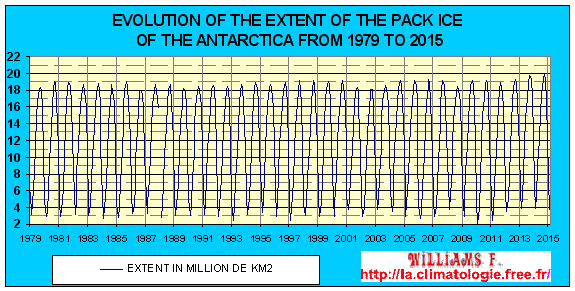
Created and updated according to NOAA data
SYNCHRONIZATION
BETWEEN THE SEA ICE OF THE NORTH POLE AND SOUTH POLE
After analyzing methane drilling ice cores in Greenland Grip in 1992 and that of Antarctica that showed a good time resolution in the evolution of temperatures of the poles. The concentration of methane shows large and rapid changes at the poles made during the passage of warming or cooling during the last glacial period (from -100,000 to -12,000 years before the present). It's 24 "Dansgaard-Oeschger" (D / O) events that occurred during the last glacial period. These events are sudden warming of 46,4-60,8°F (8-16°C) which are developed in less than 300 years. Which is fast compared to an input or an output of an ice age which is about 10,000 years. These oscillations have occurred approximately about every 1470 years during the Dansgaard-Oeschger events, but during the Holocene, the result has waited more than 3000 years to manifest. Some scientists estimate that this could occur when the minimum or the maximum of solar activity of Suess and Gleissberg cycles occur simultaneously. But evidence has not yet been found.
Following the analysis of Thomas Blunier and colleagues temperature changes in the Arctic and Antarctica have evolved the opposite.When Greenland starts to warm up during Dansgaard-Oeschger events, Antarctica has a reverse behavior and cools.
The cause of this opposite evolution between the two poles could be due to ocean currents because during the Dansgaard-Oeschger events sedimentary data show that ocean circulation is disrupted. Because the melting of the ice of the north pole during the warming would slow the thermohaline circulation because rejected fresh water would disrupt the thermohaline diving in North Atlantic which would destabilize the Gulf Stream, the main current of the North Atlantic. So when the Gulf Stream brings no more heat to the North, the North Pole cools and the heat that is stored in the Southern Ocean warms the south pole with a lag. Changes in Antarctica are more progressive and less important than that of the North Pole. Then when it ocean current restarts, it warms again Greenland and reverse for the Antarctic.
In 1988, analyzing the marine sediments of the North Atlantic, the German geologist Hartmut Heinrich found detritus scraped by glaciers. These events would have occurred six times during the last glacial period. All of them are written H0, H1 to H7 for the latter.
|
DATE OF HEINRICH EVENTS
|
H0
|
H1
|
H2
|
H3
|
H4
|
H5
|
H6b
|
H6
|
H7
|
|
10 500
|
16 800
|
24 000
|
31 000
|
38 000
|
45 000
|
54 000*
|
60 000
|
70 000
|

Evolution of temperature in Antarctica and Greenland
during Dansgaard-Oeschger events. Source : RealClimate
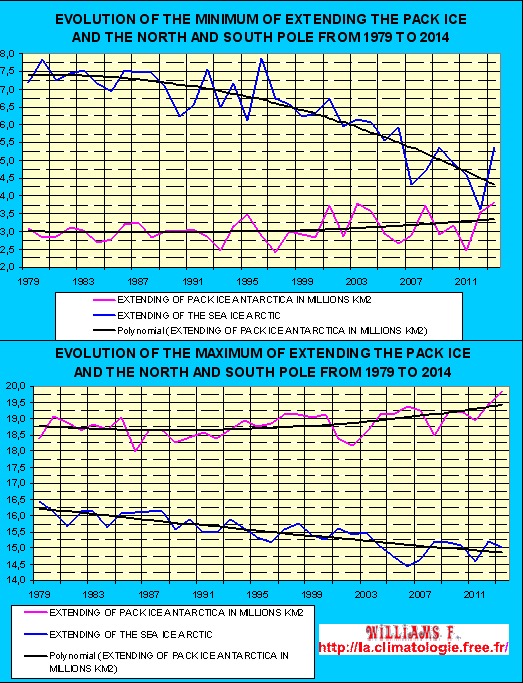
As shown in this diagram, the minimum extension
of the pack ice during the
boreal or austral summer as well as the maximum extension of the pack
ice
during the boreal or austral winter in the Arctic and Antarctica have
evolved to
opposite over the past 31 years. Created and updated according to
the NOAA
![]()
WARNING
Patricia
Régnier helped me correct mistakes, please you to visit her
blog
I’m not english speaker, some improprieties can appear to english
masters.
Could you help me reporting by mail any fault you read. Thank you for
all.
Contact :

|
|
|