 Atmosphere
 Atmos. turbulences
 Ocean and climate
 Natural Factors
 Climatic and oceanic phenomenas
 Photos, videos
 Diverse
 Simulations...
|
|
|
|
|
|
|
|
 |
A.O.
- DESCRIPTION
The A.O. (Arctic Oscillation) is a climate variation that has about the same characteristics as the NAO (North Atlantic Oscillation). But the latter has a regional character whose influence is centered on the North Atlantic while the action of the AO is more extensive as it has an influence on the entire northern hemisphere and therefore the pressures in the North Pacific are also considered. Because the Arctic Oscillation index is calculated according to the difference in atmospheric pressure between the North Pole and the mid-latitude northern hemisphere (45° surroundings).
|
When the AO is positive-phase the atmospheric pressure is lower than normal at the north pole and higher than normal at the mid-latitude (approximately 45° North). This causes a very strong West wind. As with the NAO, during winters, the temperatures in Quebec, Greenland, North Africa and the Middle East are then lower and higher in Europe and in the west of USA. And the weather is wetter in Alaska, Scotland and Scandinavia but drier in the west of the USA and in the Mediterranean. During the positive phase in Arctic the water circulation is reduced which reduces the thickness of the ice sea. The advection on the Canadian side is reduced and the passage in the Fram and the Atlantic Strait is easier as there is less ice. |
|

- A.O. -
|
When the AO is negative phase then there is high pressures on the polar region and low pressures at the mid-latitude (approximately 45° North). The atmospheric pressure which is greater in the north pole decreases the strength of the West wind. In winter the temperatures are higher than normal in Quebec, Greenland, North Africa and the Middle East, but lower in Europe and in the west of USA. In the negative phase the circulation of waters in the Arctic turns in the direction of clockwise "spiral of Beaufort", which increases the thickness of the ice sea by allowing the ice to remain in the cold of the Arctic centre. |
|

- AO INDEX
Just like its cousin, the AO is quantified by an index. It is according to the variation in atmospheric pressure in pole that the AO index varies. It has been observed that when the pressure is lower than normal over the Arctic, the index is positive. But when the atmospheric pressure is higher than normal, the index is negative.
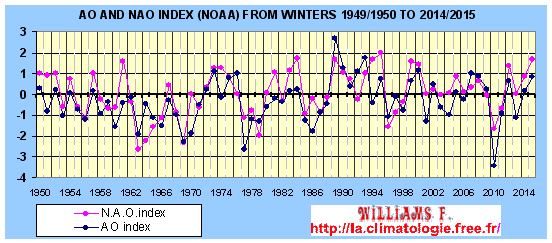
Created and updated
according to the data of NOAA
for the NAO and of
NOAA for the AO
Comparison during a AO- and a AO+ with the atmospheric
pressure (SLP)
in tires then the temperatures anomalies of the air in colour (SAT)
in
linear Spatial model (LP) for (a) and nonlinear (NLP) for (b)
and precipitations anomalies (PRCP) in linear Spatial
model (LP) for (c) and nonlinear (NLP) for (d).
THE CAUSES OF AO
The coupling of the troposphere and stratosphere could be a cause of the AO. The Arctic Oscillation is strongly linked to the strength of the stratospheric polar vortex. The stratospheric circulation anomalies are propagated up and down to the surface of the troposphere in at least three weeks occur mainly in winter. They are the ones that have effects on the sign of the AO index. More the polar vortex is strong then higher is the AO positive index and more the polar vortex is low then lower is the AO negative index..
Strong polar vortex

Weak polar vortex

The blue corresponds to the positive values so
a strong polar vortex while the red
corresponds to negative values that is a weak polar vortex. The horizontal
line
indicates the approximate boundary between the troposphere and stratosphere.
According to Baldwin and others, the QBO could have secondary effects on the polar vortex and hence the AO. When the QBO is in phase of the East the polar vortex would tend to be lower and therefore the AO would more easily be in negative phase.

This diagram created and updated according to
the NOAA
data shows
the link between the troposphere and stratosphere coupling during winter
from 1957/1958 to the last winter. The blue
corresponds to a strong vortex while
red to a low vortex. The g
indicate the major stratospheric warmings and each
"C"
indicates a Canadian warming less severe until 1995. As it can be seen
the downward spread of positive or negative anomalies not always fall
much down.
WARNING
Patricia
Régnier helped me correct mistakes, please you to visit her
blog
I’m not english speaker, some improprieties can appear to english
masters.
Could you help me reporting by mail any fault you read. Thank you for
all.
Contact :

![]()
|
|
|