|
(TAV)
TROPICAL
ATLANTIC VARIABILITY
|
1st PART
TROPICAL
ATLANTIC VARIABILITY
The TAV (Tropical Atlantique Variability)
it's the fluctuation of all of the following variations
: sea surface temperature (SST), sea-level pressure (SLP),
circulation of Hadley of the intertropical convergence zone
(ITCZ), and the wind direction changes. The event usually
takes place in March, April and may (MAM). All this is dominated
by interannual and decadal changes.
The TAV is often called "El Niño
of the Atlantic" and is associated with the trade winds
as El Niño
in the Pacific. Depending on the strength of the trade winds,
Southeast, it warms the ocean water alternately southward
to Ecuador, then north and back south of the equator.
The Tropical Atlantic Oceanographic
index are :
-
The TNA (Tropical North Atlantic)
(15-80°W, 6-22°N)
-
The TSA (Tropical South Atlantic)
(15°E-35°W 22-2°N)
- Le TNSD = TNA-TSA
Click
here to see an animation of the
Tropical Atlantic SST anomaly (in kelvin)
|

Le TNA à
gauche et le TSA à droite. Les rectangles
en
tirés indiquent où sont calculé
les indices du TNA et du
TSA. Les petits cercles jaunes indiquent les positions
d'amarrage de PIRATA [Servain et autres, 1998 ]
|

The curve of the Tropical Atlantic
gradient index, formed by
the difference between the index of the SST of Tropical
North
Altantic (TNA) and the Tropical South Atlantic (TSA).
|
Unlike El Niño or La Niña
where their oscillation is from West to East or vice
versa, the TAV is from North to South or vice versa.
In response to SST anomaly of the
TNA and the TSA, an anomaly of the wind is developed
near the Equator due to the gradient of atmospheric
pressure at sea level. Due to the Coriolis force,
the equatorial South winds evolve in an anomaly of
the south-westerly winds in North of the tropical
areas of the Atlantic, while in the South of the tropical
areas of the Atlantic anomaly is on the southeast
winds. This reduces the trade winds in the North East
of the TNA and increases in the Southeast of the TSA.
Then the heat flow of the ocean surface is increased
in the Northern hemisphere due to a reduction caused
by a decrease in the speed of the winds. And for the
opposite reason, the heat flow is decreased in the
Southern Hemisphere. Then the unstable air interaction
is opposed by negative reactions. A suitable balance
between the positive and negative reactions then causes
an oscillation of approximately 12-13 years.
It has been proven that the NAO
(North Atlantic Oscillation) has effects on the TNA
and so excite the TAV but isn't condition previously
required for the variation of the Tropical Atlantic.
Moreover TAV also has impact on the NAO according
to the variability of NADW (North Atlantic Deep Water)
and stability of the MOC ( Meridionale Ocean Circulation
of Atlantic) so the thermohaline circulation due to
the advection of the SSS (sea surface salinity) anomaly
in north of the hot water sector of the MOC .
|
|
ENSO has a considerable influence on the
Tropical Atlantic variability during the boreal spring.
ENSO can increase the variability to both the north and
south of Tropical and Equatorial Atlantic. However, this
influence is associated with the reaction of the ocean -
atmosphere and would be much less effective if this reaction
is absent. Approximately 30% of the variation of the TNA
index may be explained by the effect of ENSO and 30% by
the NAO.
The SST oscillations of the TNA are associated
with a natural variation model known as
the AMO (Atlantic Multidecadal Oscillation).
The important anomalies of precipitation in the Sahel
(Lamb, 1978) in the North East of Brazil (Hastenrath and Heller,
1977) and many others, are related to the variation of the
Tropical Atlantic.
The Tropical North Atlantic (TNA) in 15-80°W 6-22°N,
is the region where the hurricanes and tropical storms develop.
Therefore the variation of the SST of TNA has effects on the
number of hurricanes. In 2005 (June to October) it was very
high with an anomaly of 33,62°F (+0,90°C) which caused
a lot of records
on the tropical hurricanes and storms in Atlantic (number,
power, size, damage...). Of course it isn't the only phenomenon
to influence the number of hurricanes in the North Atlantic.
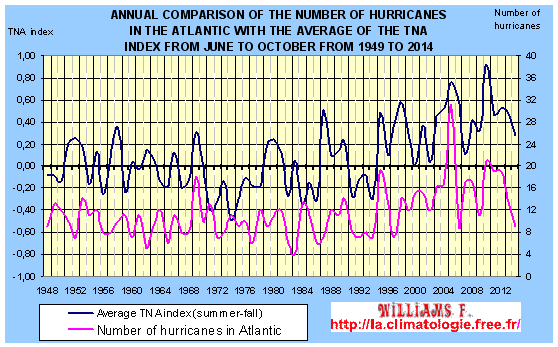
This graph is made and updated with
the NOAA
data for the
TNA index and with Unisys
Weather for the number of hurricanes.
WARNING
Patricia
Régnier helped me correct mistakes, please you to visit
her
blog
I’m not english speaker, some improprieties can appear
to english masters.
Could you help me reporting by mail any fault you read. Thank
you for all.
Contact :
 Atmosphere
 Atmos. turbulences
 Ocean and climate
 Natural Factors
 Climatic and oceanic phenomenas
 Photos, videos
 Diverse
 Simulations...


