 Atmosphere
 Atmos. turbulences
 Ocean and climate
 Natural Factors
 Climatic and oceanic phenomenas
 Photos, videos
 Diverse
 Simulations...
|
N.A.O
or O.N.A
(North Atlantic Oscillation ) |
1st PART
|
|
|
|
|
|
 |
NAO
- DESCRIPTION
The NAO (North Atlantic Oscillation) is a variation of the natural climate which has an important impact on the climate of the Western Europe, in the surrounding of Northern Africa and Eastern North America. The NAO has much more important effects in winter than in summer. It was around 1920 that the two meteorologists, the Austrian Friedrich and English Gilbert Walker discovered the North Atlantic Oscillation.
This oscillation also has some influence, because it determines the position and trajectory of depressions in the northern hemisphere. The variation of this phenomenon depends on the atmospheric pressure.
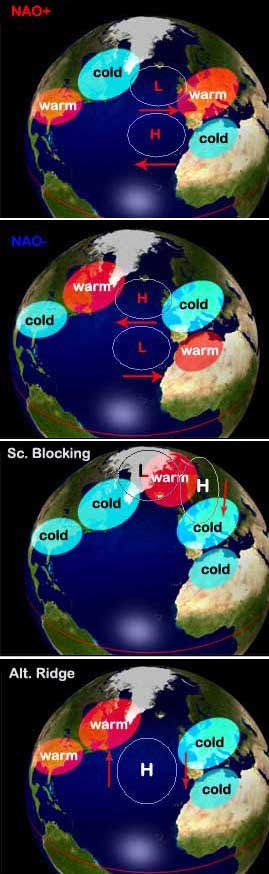
- THE NAO +
|
The greater the difference is in pressure anomaly between the Azores (High Pressure) and Iceland (Low Pressure) then the more the NAO index is positive. Then an strong west wind blowing eastward bringing the sweetness of the Atlantic Ocean on the central and southern Europe and the rain on northern Europe and pushing cold air coming from Siberia. The southeastern United States has a milder and humider winter but the Quebec and Greenland have a colder and dryer winter. The jet-Stream is located more to the north as well as the trajectories of depressions that seem more intense during positive phase of the NAO. With a more significant difference of pressure between the Azores anticyclone and the Iceland depression, Europe has more storms and stronger. |
 |

|
Less the difference is in pressure anomaly between the Azores (High Pressure) and Iceland (Low Pressure) the more the NAO index is negative. As the West wind is calm the Siberian anticyclone brings cold and dry air on Europe. The atmospheric disturbances are further south, bringing rains on the Mediterranean regions. The southeastern United States has a colder winter but the Quebec and Greenland have a milder winter. During the NAO- the Jet-Stream is located more to the south that during the NAO+. This is the reason why North Africa is more humid than normal. |
 |
NAO INDEX
|
This oscillation can be quantified by an index. The index is calculated with the easiest method which is the difference in the atmospheric pressure of a meteorological station near the Azores (Lisbon and Ponta Delgada or or Gibraltar, etc.) and a station near the depression of Iceland (Reykjavik and Akureyri or Stykkisholmur, etc.) according to the formula Rogers (1984). The index is calculated for each winter and it is between -5 and +5. To the right a diagram shows the geostrophic circulation associated with the NAO. Fp indicates the pressure force, Fc the Coriolis force and Vg geostrophic wind parallel to isohypses lines (increased pressure in red solid line, drop in pressure in blue dotted line). The traditional places for the calculation of the NAO index are marked by color points (red for the Azores and blue for the Iceland) . |
 |
Here are details of the calculation :
Am,y
and Dm,y monthly
means of pressure which m is the month (m
= 1 to 12) and y the year (y
= y1 to y2).
For each month are calculated the average and standard deviation
for A (the Anticyclone of the Azores) and
D (depression of Iceland) separately and on
a reference period (we chose logically periods of 30 years as 1961-1990
or 1971-2000) :
Then after each monthly data is normalized by subtracting the
mean of the corresponding month then it is divided by its standard
deviation :
We do the same exercise for Dm,y and the NAO index for a month m and a year y given is defined by :
|
NAOm,y
= A'm,y
- D'm,y
|
Then the winter NAO index NAOhiv which represents the average of the months of December, January and February, we obtain a time series with a value annually.
| _1_
(NAOdec,y
- 1 +
NAOjan,y +
NAOfev,y)
=NAOhivy .. 3 |
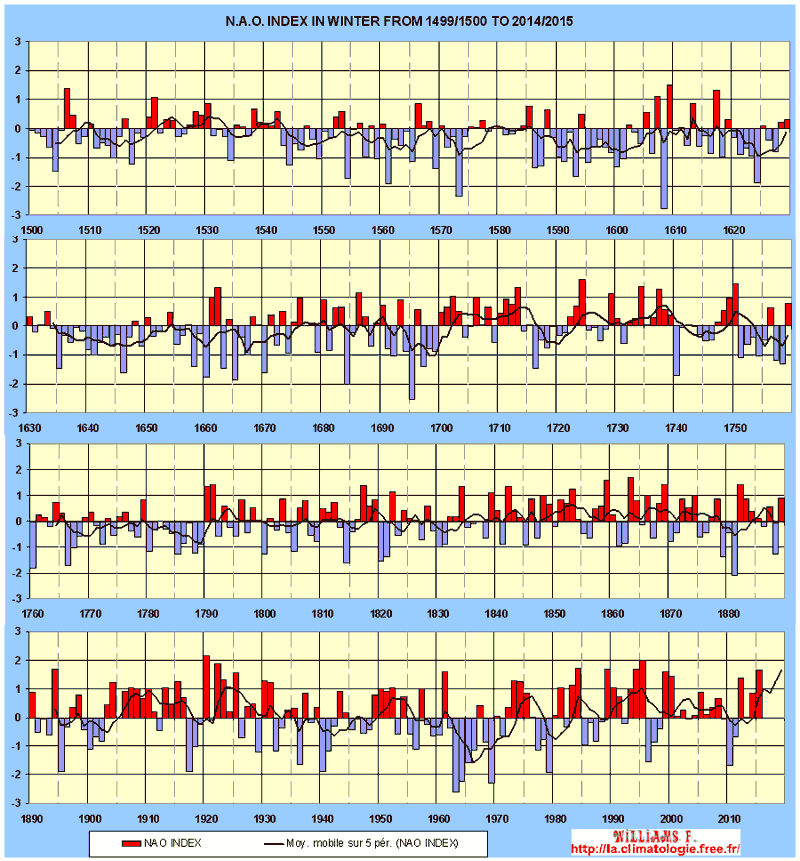
This graph
is created following the reconstruction of the index by UEA
from
years 1500 to 1658 and is updated according to the data recorded
by NOAA
SEASONAL FORECAST
The NAO is the climate phenomenon that has the most effect on winters. About 15% of the monthly variance of the NAO in early winter would seem predictable to several months in advance. According SST ( Sea Surface Temperature) anomaly in North Atlantic in July, August and September it is possible to predict if the NAO index is going to be positive or negative and therefore to have an idea if the winter is going to be correct or cold or mild.
- If the SST anomaly is positive to the east
of the North Atlantic Ocean, along the Tropic of Cancer and
between southern Greenland and Iceland, but negative in southeastern
Newfoundland then this provides for a winter with NAO-. This
oceanic structure is called "horseshoe" (see below
fig. A) [Czaja and Frankignoul, 1999].
- If the anomaly of SST is the opposite of the above cited and therefore characterized by a kind of "tripole" in latitude is associated with the NAO+ regime (see below fig. B).
The resemblance of the anomalies at the end of the summer is determined by their spatial projections on both structures figures a and b below on the right, projections that is transferred in the reduced space represented by the figure below left. When the round falls into the white space, a positive phase of the NAO is expected and reverse if the round falls into the gray area. The more the round deviates from the line of separation between the white and grey, more the NAO of the following winter will be intense. 22 forecast of the NAO on 26 winters are planned with successfully. Of course, bad forecasts exist like those winters, 1975 and 1983, where a positive NAO took place instead of the negative forecast, and years 1985 and 1986, where a positive NAO is false.
|
Projection of the anomalies in the end of summer for each year in the period 1949-2003 on the two modes of Figures a and b. The blue rounds are the winters with NAO+ (two months on three for the light blue, three out of three for dark blue), yellow and orange rounds to winters dominated by the NAO- (two out of three months for the yellow, three in three for orange). White circles represent the winters where the NAO aren't predominant. Source : Cassou and al. (2004). |
|

WARNING
Patricia
Régnier helped me correct mistakes, please you to visit her
blog
I’m not english speaker, some improprieties can appear to english
masters.
Could you help me reporting by mail any fault you read. Thank you
for all.
Contact :
|
|
|