 Atmosphere
 Atmos. turbulences
 Ocean and climate
 Natural Factors
 Climatic and oceanic phenomenas
 Photos, videos
 Diverse
 Simulations...
|
4st
PART
P.D.O. (Pacific
Decadal Oscillation)
|

|
PDO
|
NEGATIVE
|
POSITIVE
|
NEGATIVE
|
|
PERIODS
|
1947 to 1977
|
1978 to 1998
|
1999 to now
|
|
EL
NINO
|
8
|
9
|
4
|
|
LA
NINA
|
13
|
5
|
5
|
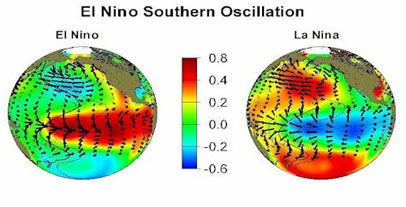
the last three phases of the PDO since 1947
By studying tropical corals it was possible to recompose the index of the P.D.O. as there is a correlation between the latter and the isotopic composition of oxygen in corals collected in Fiji islands. And several trees ring resulted it also.
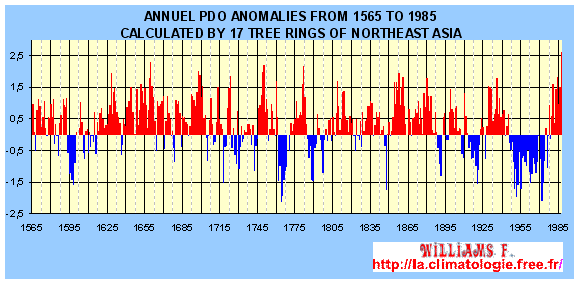
The evolution of the PDO on a long-term
maturity calculated from 17 tree
rings of Northeast Asia. This graphic is created according
to the NOAA
data
The P.D.O. index is defined as the monthly variability of the surface temperature of the North Pacific. Is calculated every 2 to 3 months.
|
The P.D.O. experienced a cold phase from 1900 to 1924 and then a warm
phase from 1925 to 1946 followed by a cold phase from 1947 to 1976
and then another warm phase from 1977 to 1998 and a cold phase
began around since 1999. This graphic is created and updated with :
Joint Institute for the Study of the Atmosphere and Ocean (JISAO)
-
CONSEQUENCES
- PDO has an impact on the change of the regional atmospheric
circulation and therefore is associated with anomalies
on precipitations and temperatures... of the United States.
During the PDO+ the droughts are more frequent in the
North and Northwest of the USA and less frequent in the
Southwest and the North American Center. And during the
PDO- all the reverse is facing the United States.
Anomaly of precipitations depending on the PDO
- PDO has an impact on the change of the regional atmospheric
circulation and therefore is associated with anomalies
on precipitations and temperatures... of the United States.
During the PDO+ the droughts are more frequent in the
North and Northwest of the USA and less frequent in the
Southwest and the North American Center. And during the
PDO- all the reverse is facing the United States.
|
The climate of North America is influenced by long-term PDO but also by AMO. And so these two oscillations long periods may contradict or vice versa and thus amplify the anomalies in rainfall, temperatures and atmospheric pressure. On the right you have a comparison of the indices of the two climatic phenomena : "A" PDO and "B" AMO.
|
 |
- Owing to the change in the Pacific SST the number of certain fishes varies.

| The abundance of salmon showed a clear correlation with the variations in climate of the 20th century in the Pacific. In the North West Pacific the salmon is more abundant during the cold phase of the PDO and less abundant during the warm phase while it is quite the opposite in Alaska.. |
 |
WARNING
Patricia
Régnier helped me correct mistakes, please
you to visit her
blog
I’m not english speaker, some improprieties can
appear to english masters.
Could you help me reporting by mail any fault you
read. Thank you for all.
Contact :
![]()
|
|
|