 Atmosphere
 Atmos. turbulences
 Ocean and climate
 Natural Factors
 Climatic and oceanic phenomenas
 Photos, videos
 Diverse
 Simulations...
|
P.N.A
(PACIFIC NORTH AMERICA) |
|
|
|
|
|
|
 |
PNA
DESCRIPTION
PNA (Pacific North American) is a natural variation in the climate with a positive and negative phase which has an impact on the climate of North America. As the NAO, has more significant effects in winter than summer and therefore the anomalies caused by the NAP are visible during the winter months only. During the summer, abnormal conditions are more difficult to detect.
This is a"quadrupole"atmospheric model of atmospheric pressure anomalies ranging from subtropical western Pacific to the east coast of North America, because this oscillation varies with the position of depressions and anticyclones. The anomalies with similar signs are located at the south of the Aleutian Islands and at Southeastern United States and those with opposite signs to these two latter areas are close to Hawaii and the Rocky Mountains to the west of the North America.
The model of PNA is associated with strong fluctuations in the strength and location of Jet Stream coming from the east of Asia.
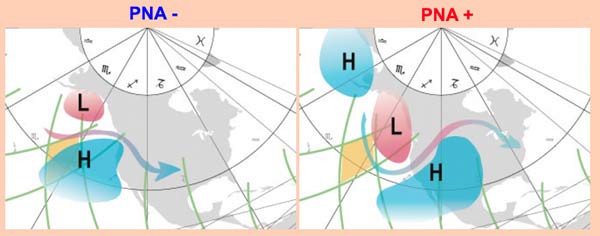
Position of the jet stream, anticyclones (H)
and depressions (L) during PNA+
and PNA-
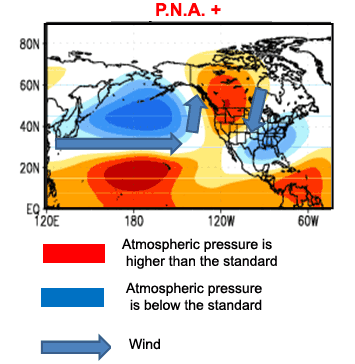
PNA +
|
The positive phase of the PNA is characterized by pattern of higher-than-average atmospheric pressure in the vicinity of Hawaii and over the mountainous region of western North America, and lower-than-average pressure in south of Alaska and over the southeastern United States. This phase is associated with a higher upper-level of meridional flow. The PNA index appears more often positive in years with El Nino. The positive phase of the PNA is associated with higher than the average temperatures on the West Coast of the United States and western Canada, but at temperatures lower than the average across the South-Central and Southeastern States States. The precipitation anomalies are higher than the average in the West coast of Alaska and of United States (California ...), the Gulf States, Florida. Drier conditions persist on the United States Midwest and the Canadian Prairies as well as in the Pacific Northwest. The positive phase is associated with a jet stream from the East Asia which is reinforced, going tonorth in the eastern Pacific and then down to the South East over North Dakota. Then the cold fronts coming from the Hudson Bay bring over an interval of about ten days of unusual snowfall in the Mississippi Valley on the east coast of the United States and sometimes as far away as Florida |
 |
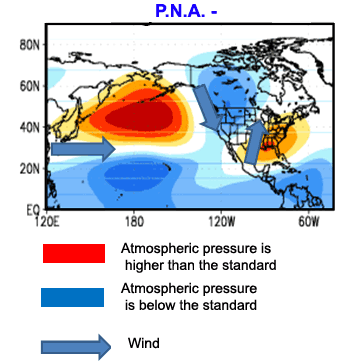
PNA -
|
It is characterized by pattern of higher-than-average atmospheric pressure off the coast of the Aleutian Islands and the southeast of the United States and lower-than-average pressure over the Rocky Mountains to the West of the United States as well as at the bottom of the Hudson Bay and in the vicinity of Hawaii. This phase is associated with a higher upper-level of zonal flow. The PNA index appears more often positive in years with La Nina but this is not always the case given the other factors that come into play. During the negative phase, the West of United States can have relatively cold temperatures, while the East of United States has rather temperatures higher than normal. The PNA- often causes severe droughts in Mt Shasta on the West Coast of the United States, while the East and the Canadian Prairies are associated with wet conditions. The negative phase gives more snow and colder temperatures in the High Plains and the Midwest of the United States. |
 |
PNA INDEX
There are two different methods to calculate PNA index, the details them are here :
PNA = 0,25 x
[Z (20°N, 160°W) -
Z (45°N, 165°W) +
Z (55°N, 115°W) -
Z (30°N, 85°W)] where
Z names the average of the
anomaly of each month following
the basis period of 1950-2000
500 hPa geopotential.
2°) - The second calculation method :
PNA = Z * (15°N-25°N, 180-140°W)-Z * (40°N-50°N, 180-140°W) + Z* (45 °N-60°N, 125 °W-105°W)-Z * (25°N-35°N, 90°W-70°W),
where Z * () denotes monthly mean 500 mb height anomaly that is obtained by subtracting the calendar mean value for each month during 1950-2000 base period.
The index is normalized using as basis the statistical period 1950-2000.
For example, in winter (DJF) for the period 1949 / 50-1999 / 2000 the coefficient of correlation between the two calculation methods is 96%.

This
graphic is created according
to the reconstruction of
the index by NOAA
in
the years 1725-1950 and
the PNA index is updated
according to the NOAA
data
WARNING
Patricia
Régnier helped me
correct mistakes, please
you to visit her
blog
I’m not english speaker,
some improprieties can appear
to english masters.
Could you help me reporting
by mail any fault you read.
Thank you for all.
Contact :
![]()
|
|
|