 .
.
|
(AMO)Atlantic
Multidecadal Oscillation
|
1st PART
ATLANTIC
MULTIDECADAL OSCILLATION
The AMO (the Atlantic Multidecadal
Oscillation) is a cyclic variation of the Oceanic
and atmospheric current in large time scale in the
North Atlantic Ocean, that combines to alternately
to increase and drop the temperature of the sea surface
Atlantic (SST). This oscillation that is multidecadal
varies on a time scale from 50 to 70 years with positive
anomalies for approximately 40 years followed by negative
anomalies of SST for approximately 20 years in the
North Atlantic with a difference of approximately
33,08°F (0,6°C) between the extremes. The
AMO is a quasi-periodic cycle, related to the variability
of the ocean thermohaline circulation. Its index shows
that from 1856 to today that there was a warm persistent
from 1856 to 1900, from 1930 to 1960 and from 1995
to day and then a cold persistence from 1900 to 1920
and from 1960 to 1995. The causes of the AMO are currently
not well known because this oscillation is long.
The AMO index is calculated by averaging
the SST between the North of Atlantic Ocean and the
equator of the Atlantic Ocean, between 0°N and
60°N, 75°W and 7,5°W.
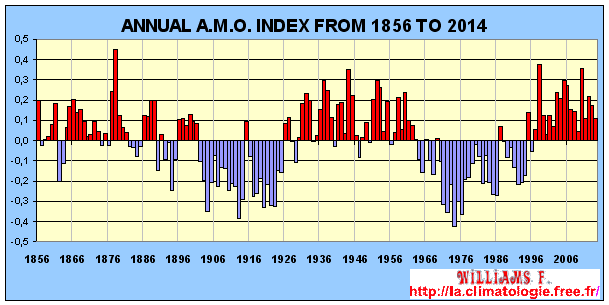
The annual index of AMO from
1856 to now. The red parts of the graph show that
the temperature of the sea surface (SST) of North
Atlantic is warmer than average
and vice versa for the South Atlantic SST and blue
parts show instead that the
North Atlantic SST was below normal while the South
Atlantic SST was above
normal. The graphic was created and is set to days
of the NOAA
data.

The evolution of the AMO on
a moving average of 10 years reconstructed from tree
rings
in North America of Eastern Europe and Western Scandinavia
from 1572 to 1980 according
to the NOAA
data and which is updated each year according
to other above NOAA data.
-
- The AMO has many effects on the climate of
the Northern Hemisphere. It has been shown that
it is responsible for approximately 15% of the warming
of 33,8°F (1°C) on the France during these
last 15-20 years ! Which is due to the exchange
of energy between the ocean and the atmosphere.
- THE
EFFECTS ON THE ATLANTIC HURRICANES
This climatic phenomenon also affects the
number and see the power of tropical cyclones in
the North Atlantic on a long-term time scales while
the QBO,
ENSO... have
effects on an annual basis.
During the positive phase of the AMO as from
1995 to present, there are more hurricanes than
during the negative phase as from 1960 to 1995.
Because when AMO is in positive phase then the
ocean circulation is faster, the westerlies (the
west wind in the mid-latitude) are shifted to
the north and the trade winds more warm up more
the ocean which is favorable for the formation
of hurricanes. While during the negative phase
the thermohaline circulation is lower, the westerly
winds are curved farther to the south. This causes
a vertical wind shear which reduces the number
of tropical hurricanes in the North Atlantic.
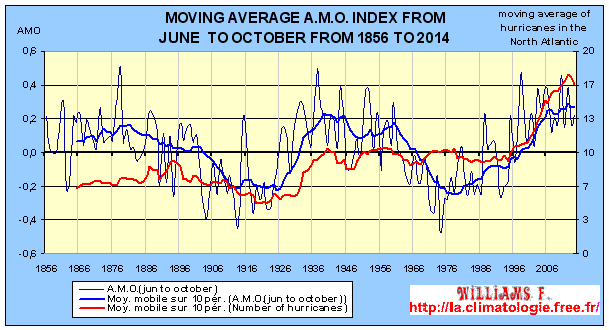
Comparison of the evolution of the
AMO index (June to October) and the
evolution of the number of tropical storms and hurricanes
in the North Atlantic.
The graph was created and it is updated according to the
data of the AMO
NOAA
and the number of hurricanes from UNISYS
WEATHER
- THE
EFFECT OF THE AMO TO NORTH AMERICA
The AMO is responsible for regional atmospheric circulation
changes and therefore associated with the precipitations
and temperatures anomalies in the United States, South
of the Mexico and probably in Western Europe.
|
During the positive phase of the AMO most
of the United States has less rainfall and
more droughts in the central west. But to
the south-western of the United States during
the warm phase precipitations are greater.
And when the negative phase of the AMO it
is quite the opposite.
Between the warm and cold phase of the
AMO, the flow of the Mississippi varies from
10%, while the inflow to Lake Okeechobee,
Florida varies from 50-40%. During cold phases
(AMO-) the average of the influx of the lake
is approximately 2 feet while during the warm
phases (AMO+) influx is about 4 feet. The
geographical pattern of variability is influenced
by changes in rainfall mainly in the summer.
On the right you have a comparison
between of the AMO index (top right) and the
percentage of rainfall in Florida (the shaded
area at the bottom right) and the percentage
of the water level in Lake Okeechobee Florida
(the blue curve below right)..
|
|
By studying the relationship between the data
records of the cut of the tree and the variation
of the climate of the past hundred years in North
America and in Europe, there are links with Atlantic
Multidecadal Oscillation.
ANOMALY
IN THE POSITIVE PHASE OF THE AMO
|
 |
 ......................
|
|
The climate of North America is influenced
by long-term variability of the AMO as seen
above but also by the climate phenomenon of
the Pacific, the
PDO. And so these two long periods oscillations
may offset or the reverse and thus amplify the
anomalies of rainfall, temperature and atmospheric
pressure.
On the right there is a comparison of
the indices of the two climate phenomena : "A"
the PDO and "B" the AMO.
|
|

Sectors smaller frequencies
(blue <25%) and higher (red> 25%) of droughts
are associated
with climate phenomena of the PDO and AMO. Note the
greater magnitude of drought
in the United States linked to the warming of SST
in North Atlantic Ocean.
Two of the most severe droughts of
the 20th century occurred during the positive AMO
between 1925 and 1965 : The "Dust Bowl",
the name given to a series of dust storms in the 1930s
and the last major drought in the Midwest, in the
mid 1950s.
- THE
IMPACT OF THE INTERTROPICAL CONVERGENCE ZONE
|

The evolution of the
rainfall anomaly in the Sahel from 1900 to
now
compared to the average from 1950 to 1979
and the evolution of the
AMO. The graph was created and is updated
with NOAA
and JJASO
data.
When the AMO is positive, a positive feedback
of air-sea develops.
|
|
Atmospheric pressure difference on the surface
of the sea between North and South lead an exceptionally
strong wind by the southeast of Africa. This wind
anomaly weakens the Northeast tradewinds. When the
trade winds "tradewinds" are weakened they
less cool water in the North, and the water grows
warmer. The hotter temperature increases the difference
in the pressure between the North and South Atlantic,
and causes a stronger wind anomaly. The feedback continues.
Due to the hot water in the North Atlantic, near the
Equator wind intensifies, the ITCZ (Intertropical
Convergence Zone) where significant rainfall occurs
moves northward.
The climate in the Northeast Brazil becomes
drier than normal. During a period of drought, many
Brazilians emigrate to more humid areas. Meanwhile,
the
Sahel region of Africa gets more rain than in
the years 80s. Each decade, these wet and dry climates
move of places because the sea surface temperature
of the North and South Atlantic ocean reverses.
And therefore their effect on the climate reverses.
WARNING
Patricia
Régnier helped me correct mistakes, please
you to visit her
blog
I’m not english speaker, some improprieties can
appear to english masters.
Could you help me reporting by mail any fault you
read. Thank you for all.
Contact :
.gif)
|
|
 Atmosphere
 Atmos. turbulences
 Ocean and climate
 Natural Factors
 Climatic and oceanic phenomenas
 Photos, videos
 Diverse
 Simulations...


