 Atmosphere
 Atmos. turbulences
 Ocean and climate
 Natural Factors
 Climatic and oceanic phenomenas
 Photos, videos
 Diverse
 Simulations...
|
N.A.O
or O.N.A
(North Atlantic Oscillation ) |
2st PART
|
|
|
|
|
|
 |
CAUSES OF NAO
This climatic phenomenon is less well known than his "brother" of the Pacific the E.N.S.O. Several factors may be the cause of this oscillation.
 |
|
(Source : R. Curry and M. McCartney, WHOI, Woods Hole, USA) This figure represents the slow variations in the NAO index of winter (red for positive index and blue for negative index), the variations in the temperature of the deep water formed in the Labrador Sea (in green, on the right scale), and variations in transportation to the east of the Gulf Stream and the north Atlantic Drift (in black, on the left scale), estimated from the differences in potential energy anomalies between Labrador Sea and Bermuda (an oceanic analogue of the atmospheric NAO Index). |
This oscillation is mostly a link between the
atmosphere and the ocean.
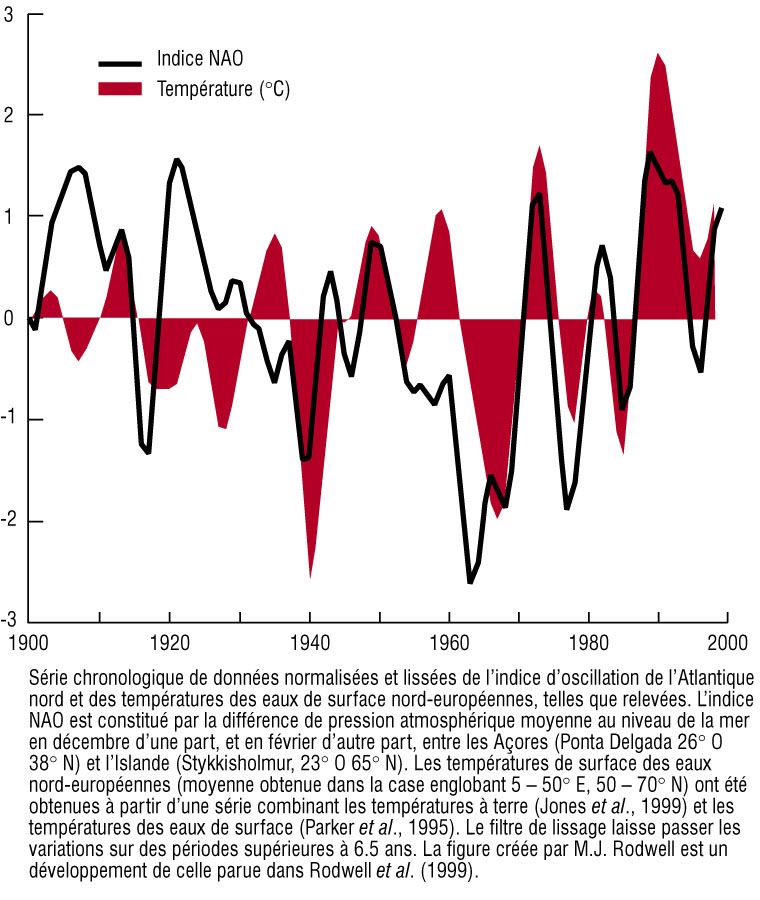
Click here to see a diagram, from 1900 to 2000, that shows us that
the NAO index follows the evolution of the SST anomaly of the Atlantic
of the Northern Europe unlike the SST anomaly of the Labrador
Sea.
The North Atlantic Oscillation (NAO) index is based on the difference in surface sea-level pressure between the Subtropical (Azores) High and the Subpolar Low. Often when the anomaly of SST (Sea Surface Temperature) is positive in the Atlantic north of Europe anticyclones occur in the Azores and depressions north Atlantic this indicates a NAO+. Then a subtropical Oceanic spiral circulation is increased which reinforces Highs and Lows pressure systems. The atmosphere in turn produces more fresh water fluxes and a Ekman transport from Newfoundland to the Greenland Sea. This reduces as and the salinity of the Labrador Sea which in turn reduces convection in South Greenland, thus weakening the strength of the thermohaline circulation. Giving a reduction in the transport of heat to the north pole. Then there is a phase reversal.
When the strength of the thermohaline circulation has weakened a negative anomaly of SST occurs weakening the Azores anticyclones and depressions in the North Atlantic so a NAO-. The subtropical Oceanic spiral circulation decreases. Then the atmosphere produces less freshwater flows and a Ekman transport toward the Labrador Sea. As the salinity of the Sea of Labrador increases and strengthens the convection in south of Greenland thus increases the strength of the thermohaline circulation and transports more heat to the North Pole.
Click here to see an animation of this oscillation, Gif format 428 kb.
Click here to enlarge this diagram that summarizes everything about the NAO
CONSEQENCES OF NAO
If the evolution of Europe winter temperatures
anomalies are compared with the NAO Index we can see that they are
very close. During the decades 80 and 90, the N.A.O. index was mostly
positive. A fact which is responsible for the relatively mild winters
during this period on the majority of the North-West Europe. While
winters in Quebec are rather cold.
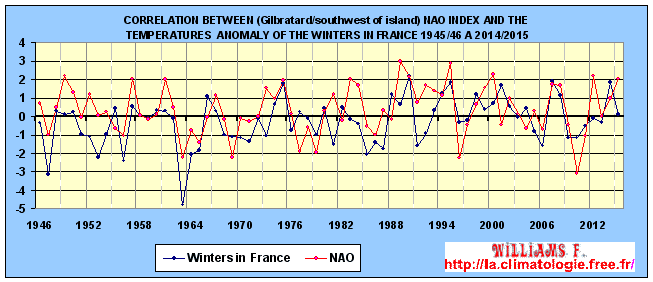
Created and updated with the
UEA data for the NAO and the
Météo-France data for the temperatures of 25 cities
in France.
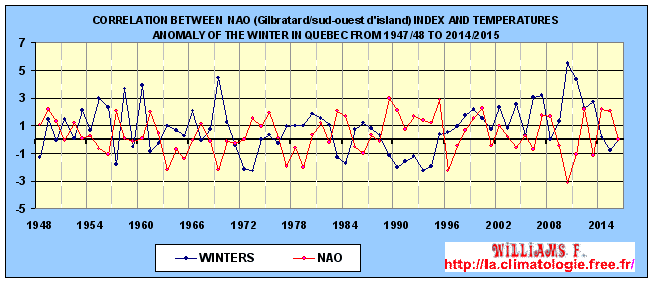
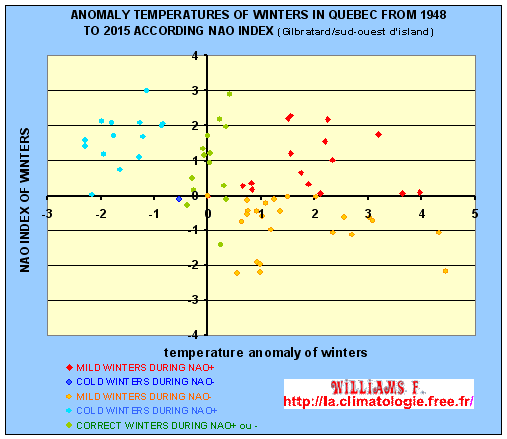
Comparison of the NAO index with the anomaly
temperatures of Quebec in winters.
THE
PERCENTAGE OF COLD / ROUGH OR MILD
OR CORRECT
WINTERS OCCURRING DURING A NAO+
and NAO-
IN QUEBEC :
|
from
|
N.A.O.
(Gilbratard / south-west of Island) |
WINTERS
|
||
|
COLD
|
MILD
|
CORRECT
|
||
|
1945/1946
to 2014/2015 |
NAO +
|
93
%
|
38 %
|
79
%
|
|
NAO -
|
7%
|
62
%
|
21 %
|
|
THE
PERCENTAGE OF COLD / ROUGH OR MILD
OR CORRECT
WINTERS OCCURRING DURING A NAO+
and NAO-
IN FRANCE :
|
from
|
N.A.O.
(Gilbratard / south-west of Island) |
WINTERS
|
||
|
COLD
|
MILD
|
CORRECT
|
||
|
1949/1950
to 2014/2015 |
NAO +
|
37 %
|
81
%
|
70%
|
|
NAO -
|
63%
|
19 %
|
30%
|
|

The NAO has effects on glaciers. When the NAO is negative the glaciers in Scandinavia (Norway and Sweden) shrink while in the Alps it's the opposite. And during a positive NAO the reverse takes place on the evolution of the glaciers.

The evolution of the average balance sheet of
representative glaciers in these two regions
(9 Alpine glaciers, 7 Scandinavian glaciers) over the period 1967-1997,
the signal having
been smoothed over five years. According to Six, Reynaud and Letreguilly
2001

Monthly air temperature, precipitation and NAO
index in Longyearbyen (Iceland) since 1965
WARNING
Patricia
Régnier helped me correct mistakes, please you to visit her
blog
I’m not english speaker, some improprieties can appear to english
masters.
Could you help me reporting by mail any fault you read. Thank you
for all.
Contact :
|
|
|