Atmosphere
 Atmos. turbulences
 Ocean and climate
 Natural Factors
 Climatic and oceanic phenomenas
 Photos, videos
 Diverse
 Simulations...
4st PART
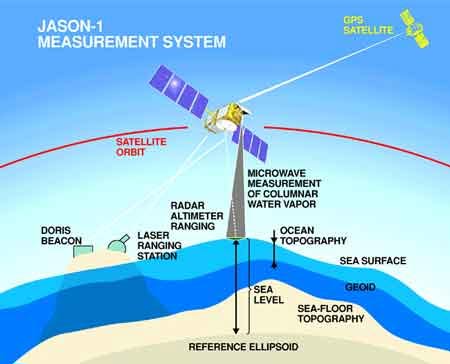
Around our blue planet have been putting satellites into orbit satellites (Jason, Topex-Poseidon...) orbit to measure the height of the oceans with their altimeter at few centimeters near. It is from this information it is possible to know what is going on in depth : the density of water, salinity, temperature, and therefore the currents. So from these data are provided and monitored the movement and extent of El Nino or La Nina..... TOPEX-POSEIDON and JASON I and II of the NASA / CNES are satellites that measure the weekly height of the sea surface (SSH) with high accuracy and oceanic currents. The instantaneous accuracy average of the local estimate of the ocean level is better than 5 cm, and the average precision on a month better than 2 cm. Here are the main satellites measuring or measured the level... of the oceans :
THE TOPEX-POSEIDON SATELLITE
THE JASON SATELLITE I
These satellites measure the height
of the water. The radar signal transmitted by the satellite
During El Niño and La Niña (ENSO) in the Pacific and the North Atlantic Oscillation (NAO) weekly sea surface height anomalies were found from measurements of the satellite Topex-Poseidon.
Calculation of the shift in sea level
in the North Atlantic (except seasonal
It is thus that from Topex-Poseidon
data from 1993 to 2000, it has been possible
WARNING
|