.


CYCLONES OR HURRICANES

2st PART

SHARE |

DESCRIPTION OF CYCLONES

TYPES AND CONDITONS OF FORMATION

LOCATIONS AND DIRECTIONS CYCLONES

NUMBER OF CYCLONE BY YEAR

CLASSIFICATION AND CONSEQUENCES OF CYCLONES

IMAGES AND ANIMATIONS OF CYCLONES

NUMBER OF CYCLONES BY YEAR

In the Atlantic ocean, is observed each year on average ten tropical cyclones. Only half of them reach the coasts of the USA every 3 years approximately. From 1900 to 1978 : 129 hurricanes have hit the USA, including 50 in Florida.

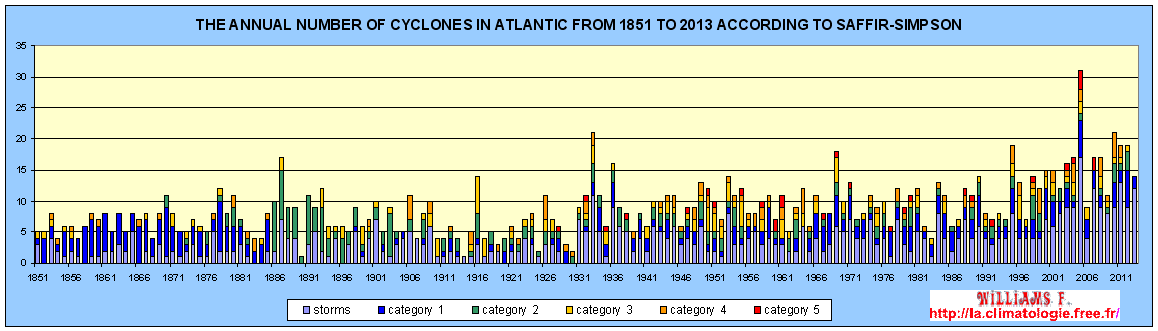
Since 1930 the hurricanes have increased in the North Atlantic. From 1886 to 2005 on average each year there were 9 hurricanes. And then from 1945 to 2005 there were approximately 11 hurricanes per year and between 1990 and 2010 the average is passed to 14 hurricanes per year.

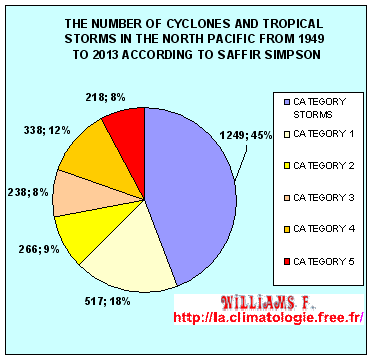
80-85 cyclones can form each year on our planet, including 45 with winds greater than 72,7 mph (117 km/h). 68% are listed in the hemisphere North and 32% only in the southern hemisphere. On average between 1990 and 2010, 58% of cyclones and tropical storms formed in the Pacific including 32% to the West, 17% to the East and 9% to the South Pacific and then 14% of hurricanes and tropical storms formed in the North Atlantic and 28% of cyclones and tropical storms formed in the Indian Ocean including 5% in the South and 23% Northern Indian Ocean.

In relation to the total number of tropical storms and hurricanes of category 1 to 5, in the Pacific ocean there is a higher percentage of violent cyclones in the Atlantic Ocean as we watch the two graphs below.


..


Click here to enlarge this diagram that represents the number of cyclones
counted each year in the Atlantic from 1851 to 2013, according to their category

These charts were created and are updated according to the data of UNISYS WEATHER

For the cyclones there are an index named ACE (Accumulated Cyclone Energy), the accumulated energy of hurricanes and tropical storms, which combines the frequency, duration and intensity of cyclones during the cyclone season.

The history of the ACE index of cyclones and tropical storms of the North Atlantic since 1852. Source : la NOAA

THE EFFECTS OF ENSO AND OTHER PHENOMENON ON THE NUMBER OF CYCLONES

Each year the number of hurricanes, cyclones and tropical storms vary according to several factors : the phase of the Q.B.O., variation in the thermohaline (temperature and salinity) of océans, the activity of E.N.S.O, rate of rainfall in the Sahel, and depending on the atmospheric pressure.

  • Depending on the phase of the QBO there are more or less of tropical cyclones.Q.B.O. which are tropical winds that sometimes blow either East or West and have a substantial influence of tropical cyclone activity. When the winds of equatorial stratosphere, QBO, are oriented towards the East (QBO West phase) to 20/23 km altitude, then there is a greater cyclonic activity 50-70% in general, especially in Indian Ocean. But when the QBO is in its East phase is the opposite. It is believed (but this has not been demonstrated) if the cyclonic activity is reduced during the years of stratospheric east wind, this is due to the increase in the vertical shear between the lower stratosphere and upper troposphere that can disrupt the structure of the tropical cyclone.

  • During periods of drought in the West of the Sahel, hurricane activity is greatly reduced in the Atlantic Basin and their intensity is less important. Whereas in wet years, there are more chances to meet more active cyclones. This is also due to a strengthening of the vertical shear in high troposphere during the drought years, causing changes in the structure of African easterly waves preventing them to evolve into cyclone.

  • According to the importance of anomaly atmospheric pressure at sea level around the Caribbean islands and the Gulf of Mexico in June and July. If there is positive anomaly relative to the seasonal average (higher pressure than normal) then the hurricane activity will be very reduced. But if it is negative, this activity will be much stronger.

  • In the Atlantic the anomaly of sea surface temperature (S.S.T.) in the North temperate zone and in the South of the Tropic of Cancer can also affect the number of hurricanes. In spring, when there is a positive anomaly (the water is warmer than normal compared with the average of the season) then there should be more hurricanes in the North Atlantic. If there is a negative anomaly is just the opposite would happen.

  • According to the phenomenon El Niño and La Niña the number and positioning of the cyclones evolves in both the North Atlantic and the Pacific.

    • During El Niño, tropical cyclones are more numerous in the Eastern Pacific, but less numerous in the West. This is due to the anomaly of sea surface temperature of the Pacific ocean but also and especially atmospheric circulation disruption particularly in tropical regions. In the Atlantic ocean the number of hurricanes decreases as El Niño creates wind shears in this region.

    • But when La Niña occurs, there is less of tropical cyclones in the Eastern Pacific, but more in the western Pacific and the Atlantic Ocean.


Comparison between the evolution of the number of cyclones in the Eastern Pacific and
North Atlantic according to the evolution of E.N.S.O (El Nino or La Nina or La Nada).
This graph was created and is updated based the data of UNISYS WEATHER

So every year it is possible to predict areas where there is the greatest risk of having tropical storms and cyclones.

WARNING
Patricia Régnier helped me correct mistakes, please you to visit her blog
I’m not english speaker, some improprieties can appear to english masters.
Could you help me reporting by mail any fault you read. Thank you for all.
Contact :