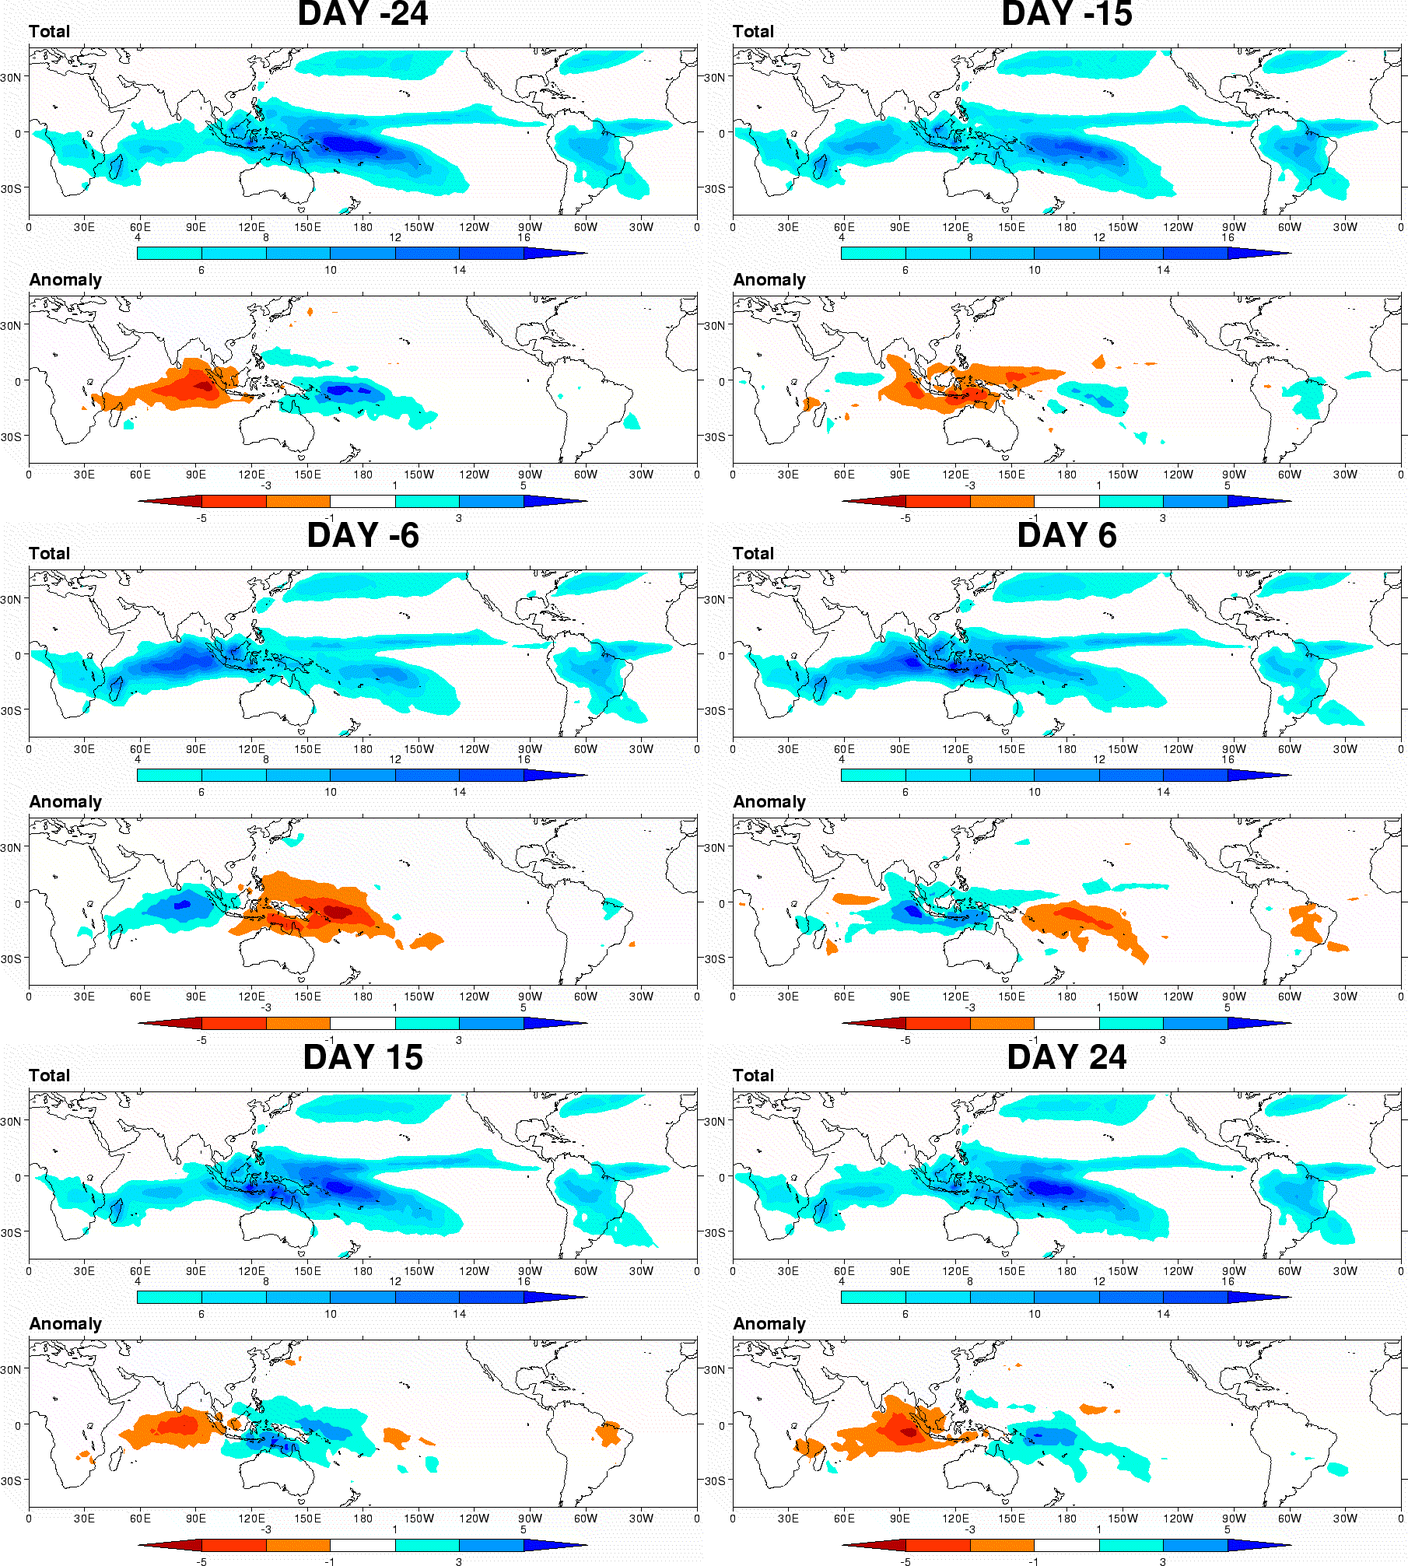
cycle of precipitations of MJO

the animation of the life cycle of the MJO : total precipitation and CMAP anomalies (legend is in mm / day-1).
overall structure of the MJO

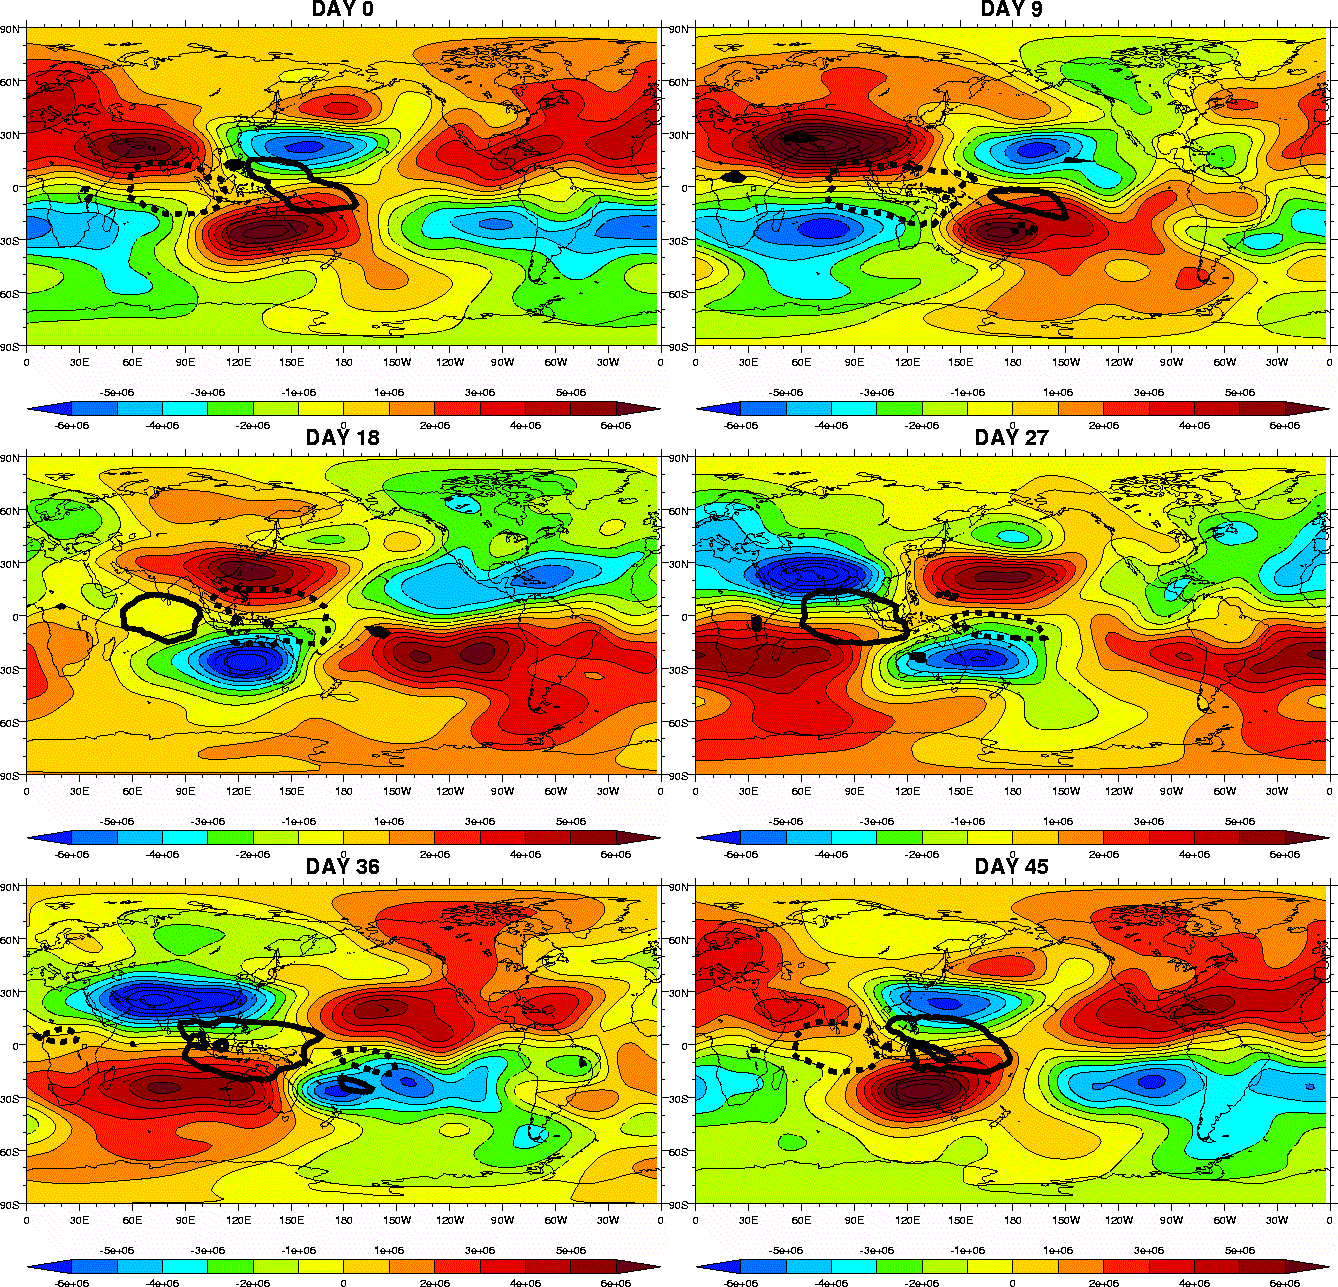
An animation of the MJO cycle in the Upper troposphere (200 hPa). The
thick dashed outline is the increased
area of rainfall and the thick solid line describes the area of reduced rainfall.
legend for shading pressure.
Equatorial Kelvin and Rossby waves

The top panel represents the pressure and distribution of winds in
the upper atmosphere. The middle panel is vertical and zonal
circulation in an equatorial plane. The bottom panel represents the pressure
and distribution of winds in the lower atmosphere .
|
|
|